|
|
|

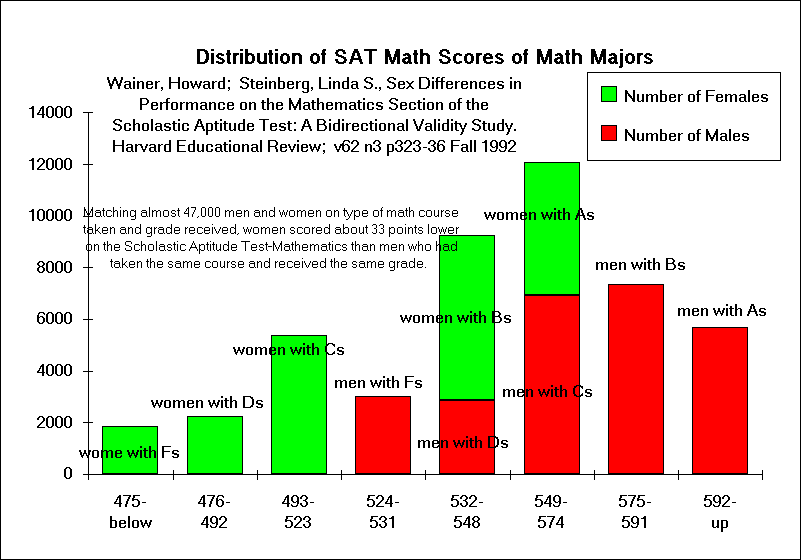
Distribution of SAT Scores of College Students
SAT math scores increase 6 points for each 1% increase in brain size!
Annual salaries increase $660 for each 1% increase in brain size.

Scores |
Number of |
Percent |
College Grade |
|||
SAT range |
Men |
Women |
Men |
Women |
Men |
Women |
(592 & up) |
5,693 |
0 |
22.0% |
0% |
A |
|
(575-591) |
7,357 |
0 |
28.4% |
0% |
B |
|
(549-574) |
6,931 |
5,144 |
26.8% |
24.5% |
C |
A |
(532-548) |
2,881 |
6,383 |
11.1% |
30.4% |
D |
B |
(524-531) |
3,030 |
0 |
11.7% |
0% |
F |
|
(493-523) |
0 |
5,394 |
0% |
25.7% |
C |
|
(476-492) |
0 |
2,235 |
0% |
10.6% |
D |
|
<475 |
0 |
1,872 |
0% |
8.9% |
F |
|
| Wainer, Howard; Steinberg, Linda S., Sex
Differences in Performance on the Mathematics Section of the Scholastic Aptitude Test: A
Bidirectional Validity Study. Harvard Educational Review; v62 n3 p323-36 Fall 1992 Matching almost 47,000 men and women on type of math course taken and grade received, women scored about 33 points lower on the Scholastic Aptitude Test-Mathematics than men who had taken the same course and received the same grade. |
Note: A more significant outcome of this study
than the 33 point difference in SAT Math scores of math majors is that 50.4% of the males
score higher than all of the female groups. 1) The median SAT Math scores of all SAT test takers in 1993 were 502 for men and 457 for women. 2) The "base score" for SAT Math tests is 200--the difference between men and women is (502 minus 457) divided by (457 minus 200) or 17.5%. 3) SAT scores accurately predict college grades as well as a future employee's math competence. |
A) The women's group's mean score was 30.7% higher than women nationally
while the men's group's was 25.8% higher than men nationally.  This is a
small but important 4.9% difference which suggests that the women's group
was not as representative of women as the men's group was of men.

B) There were 4,864 or 18.8% fewer women in the study than men.
The smaller sample size for women may be because there were not
enough high-scoring women available.  Had the sample sizes been equal,
the differences between the sexes would have been larger.  The sample
sizes for women in Advanced Math were one half (1/2) that
for men and for Calculus were 40% lower than that for men while the sample
sizes of women in Remedial Math and Regular Math were larger.  Since
women's Remedial Math scores were 48.3% lower than their Advanced
Math scores, increasing the sample size by 23.1% with students whose
average scores were 48.3% lower would have reduced women's "Grade Means"
from 536 to 517, which is 19 points or another 5.7%.